MCP Inspector
MCP Inspector is a browser-based developer tool for testing and debugging MCP servers — similar to Postman but for the Model Context Protocol. Use it to call tools interactively, browse resources, preview prompts, and inspect raw protocol messages without writing any client code.
Launch the Inspector
No installation required. Run it directly with npx:
The UI opens at http://localhost:6274. A proxy server also starts on port 6277 to handle protocol bridging.
Connect to misp-workbench
Get a token
First generate a scoped MCP token from the /mcp/config endpoint:
Copy the Bearer token value from the response — you'll paste it into the Inspector.
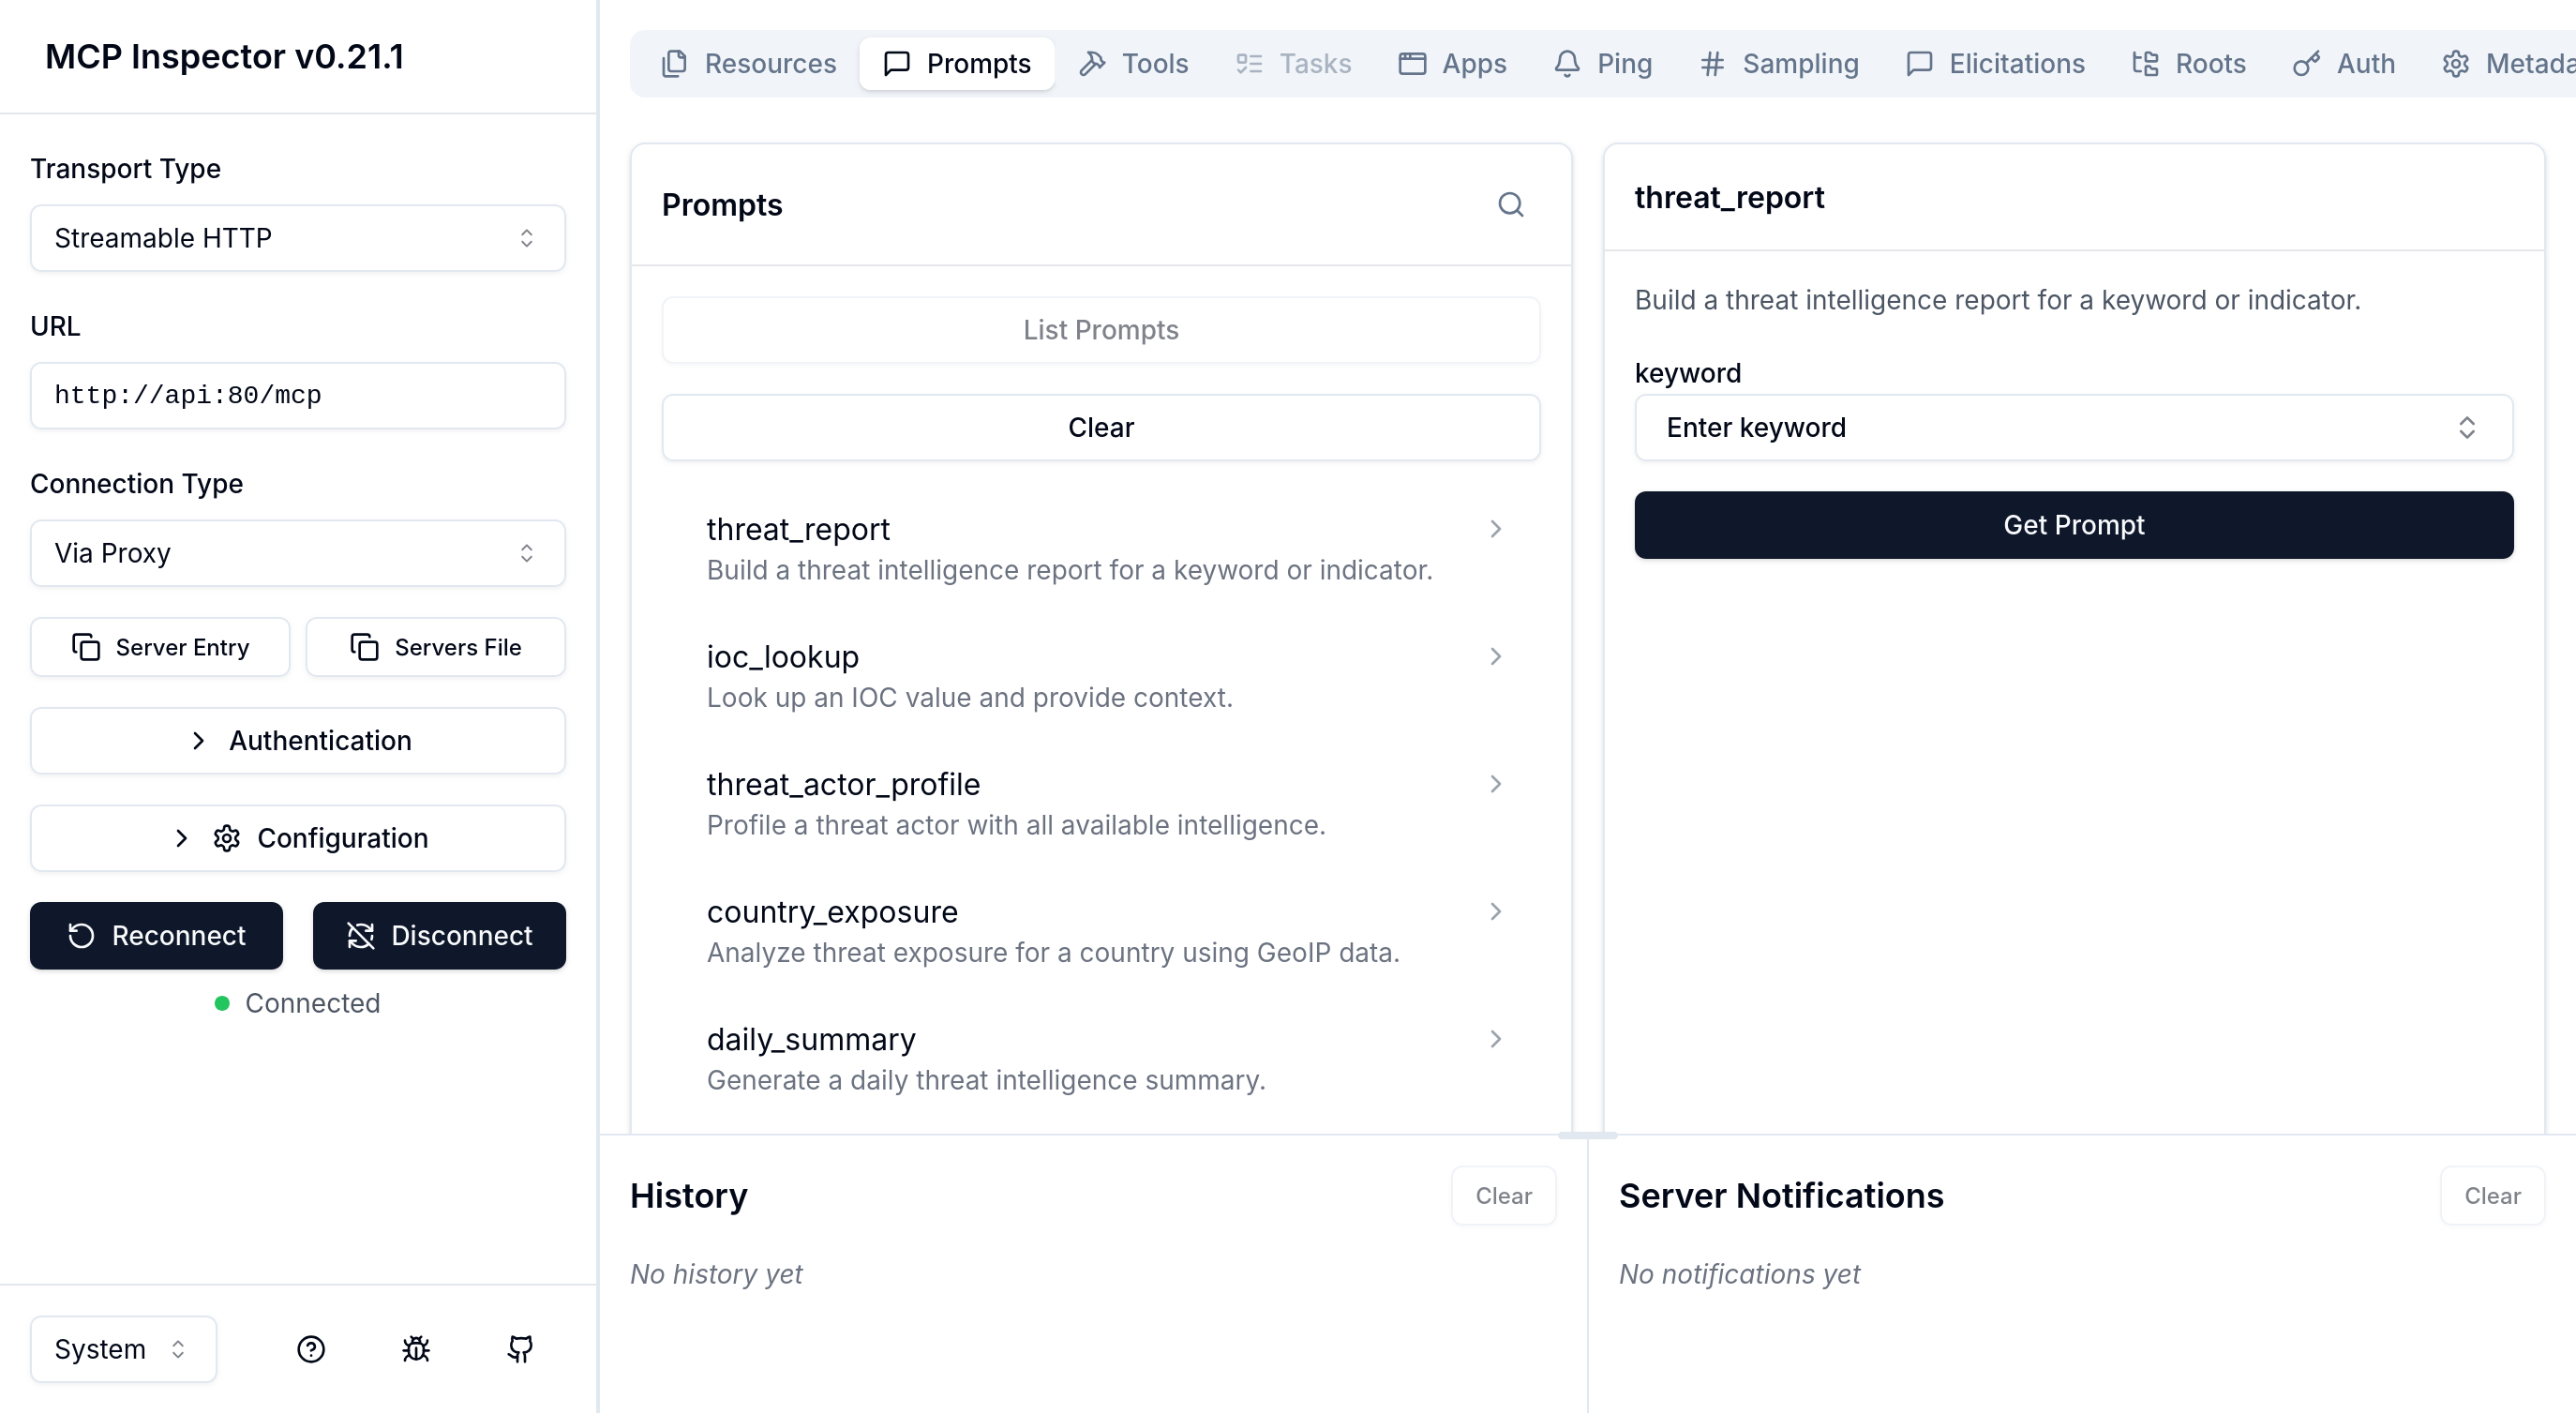
Configure the connection
In the Inspector's left sidebar:
- Set Transport to
Streamable HTTP - Set URL to
http://localhost:8000/mcp(or your instance URL) - In the Authorization field, enter
Bearer <mcp-token> - Click Connect
The Inspector completes the MCP handshake (initialize → notifications/initialized) and shows the server capabilities.
Local dev without auth
If MCP_AUTH_ENABLED=false (the default for local dev), skip the token — leave the Authorization field empty and connect directly.
What you can do
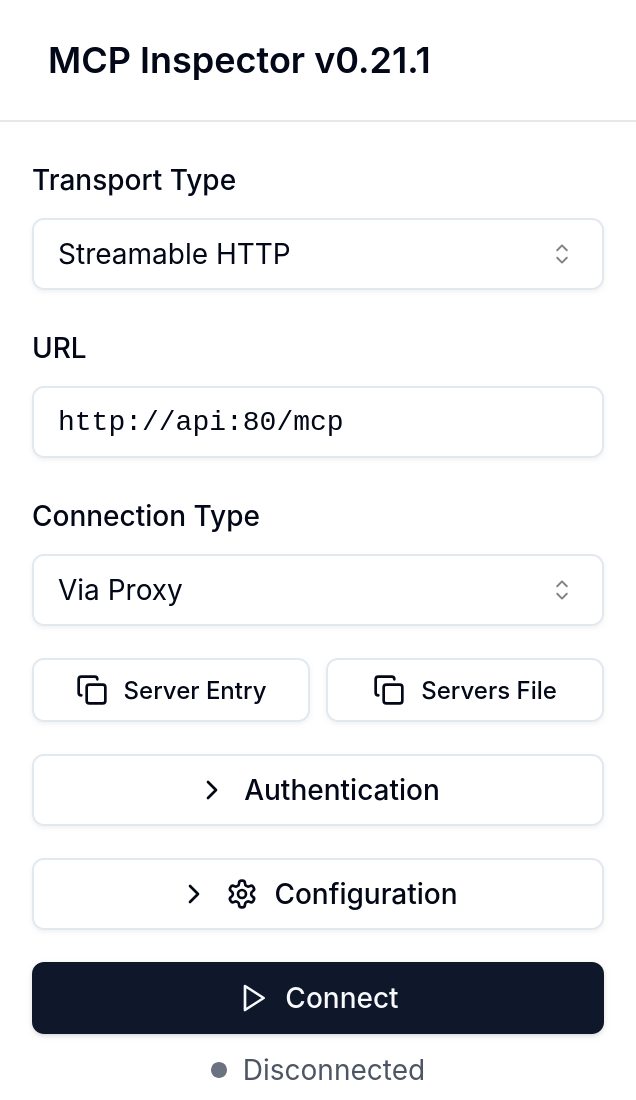
Tools tab
Lists all tools with their input schemas. Select a tool, fill in the parameters using the auto-generated form, and click Call to execute it. The raw JSON response is shown in the output pane.
Useful for verifying tool behavior before connecting an AI client:
- Test
search_eventswith Lucene queries to confirm index connectivity - Call
detect_indicator_typeon a batch of values to validate type detection - Run
enrich_indicatorto confirm a module is enabled and returning results - Trigger
create_event_reportto verify write access
Resources tab
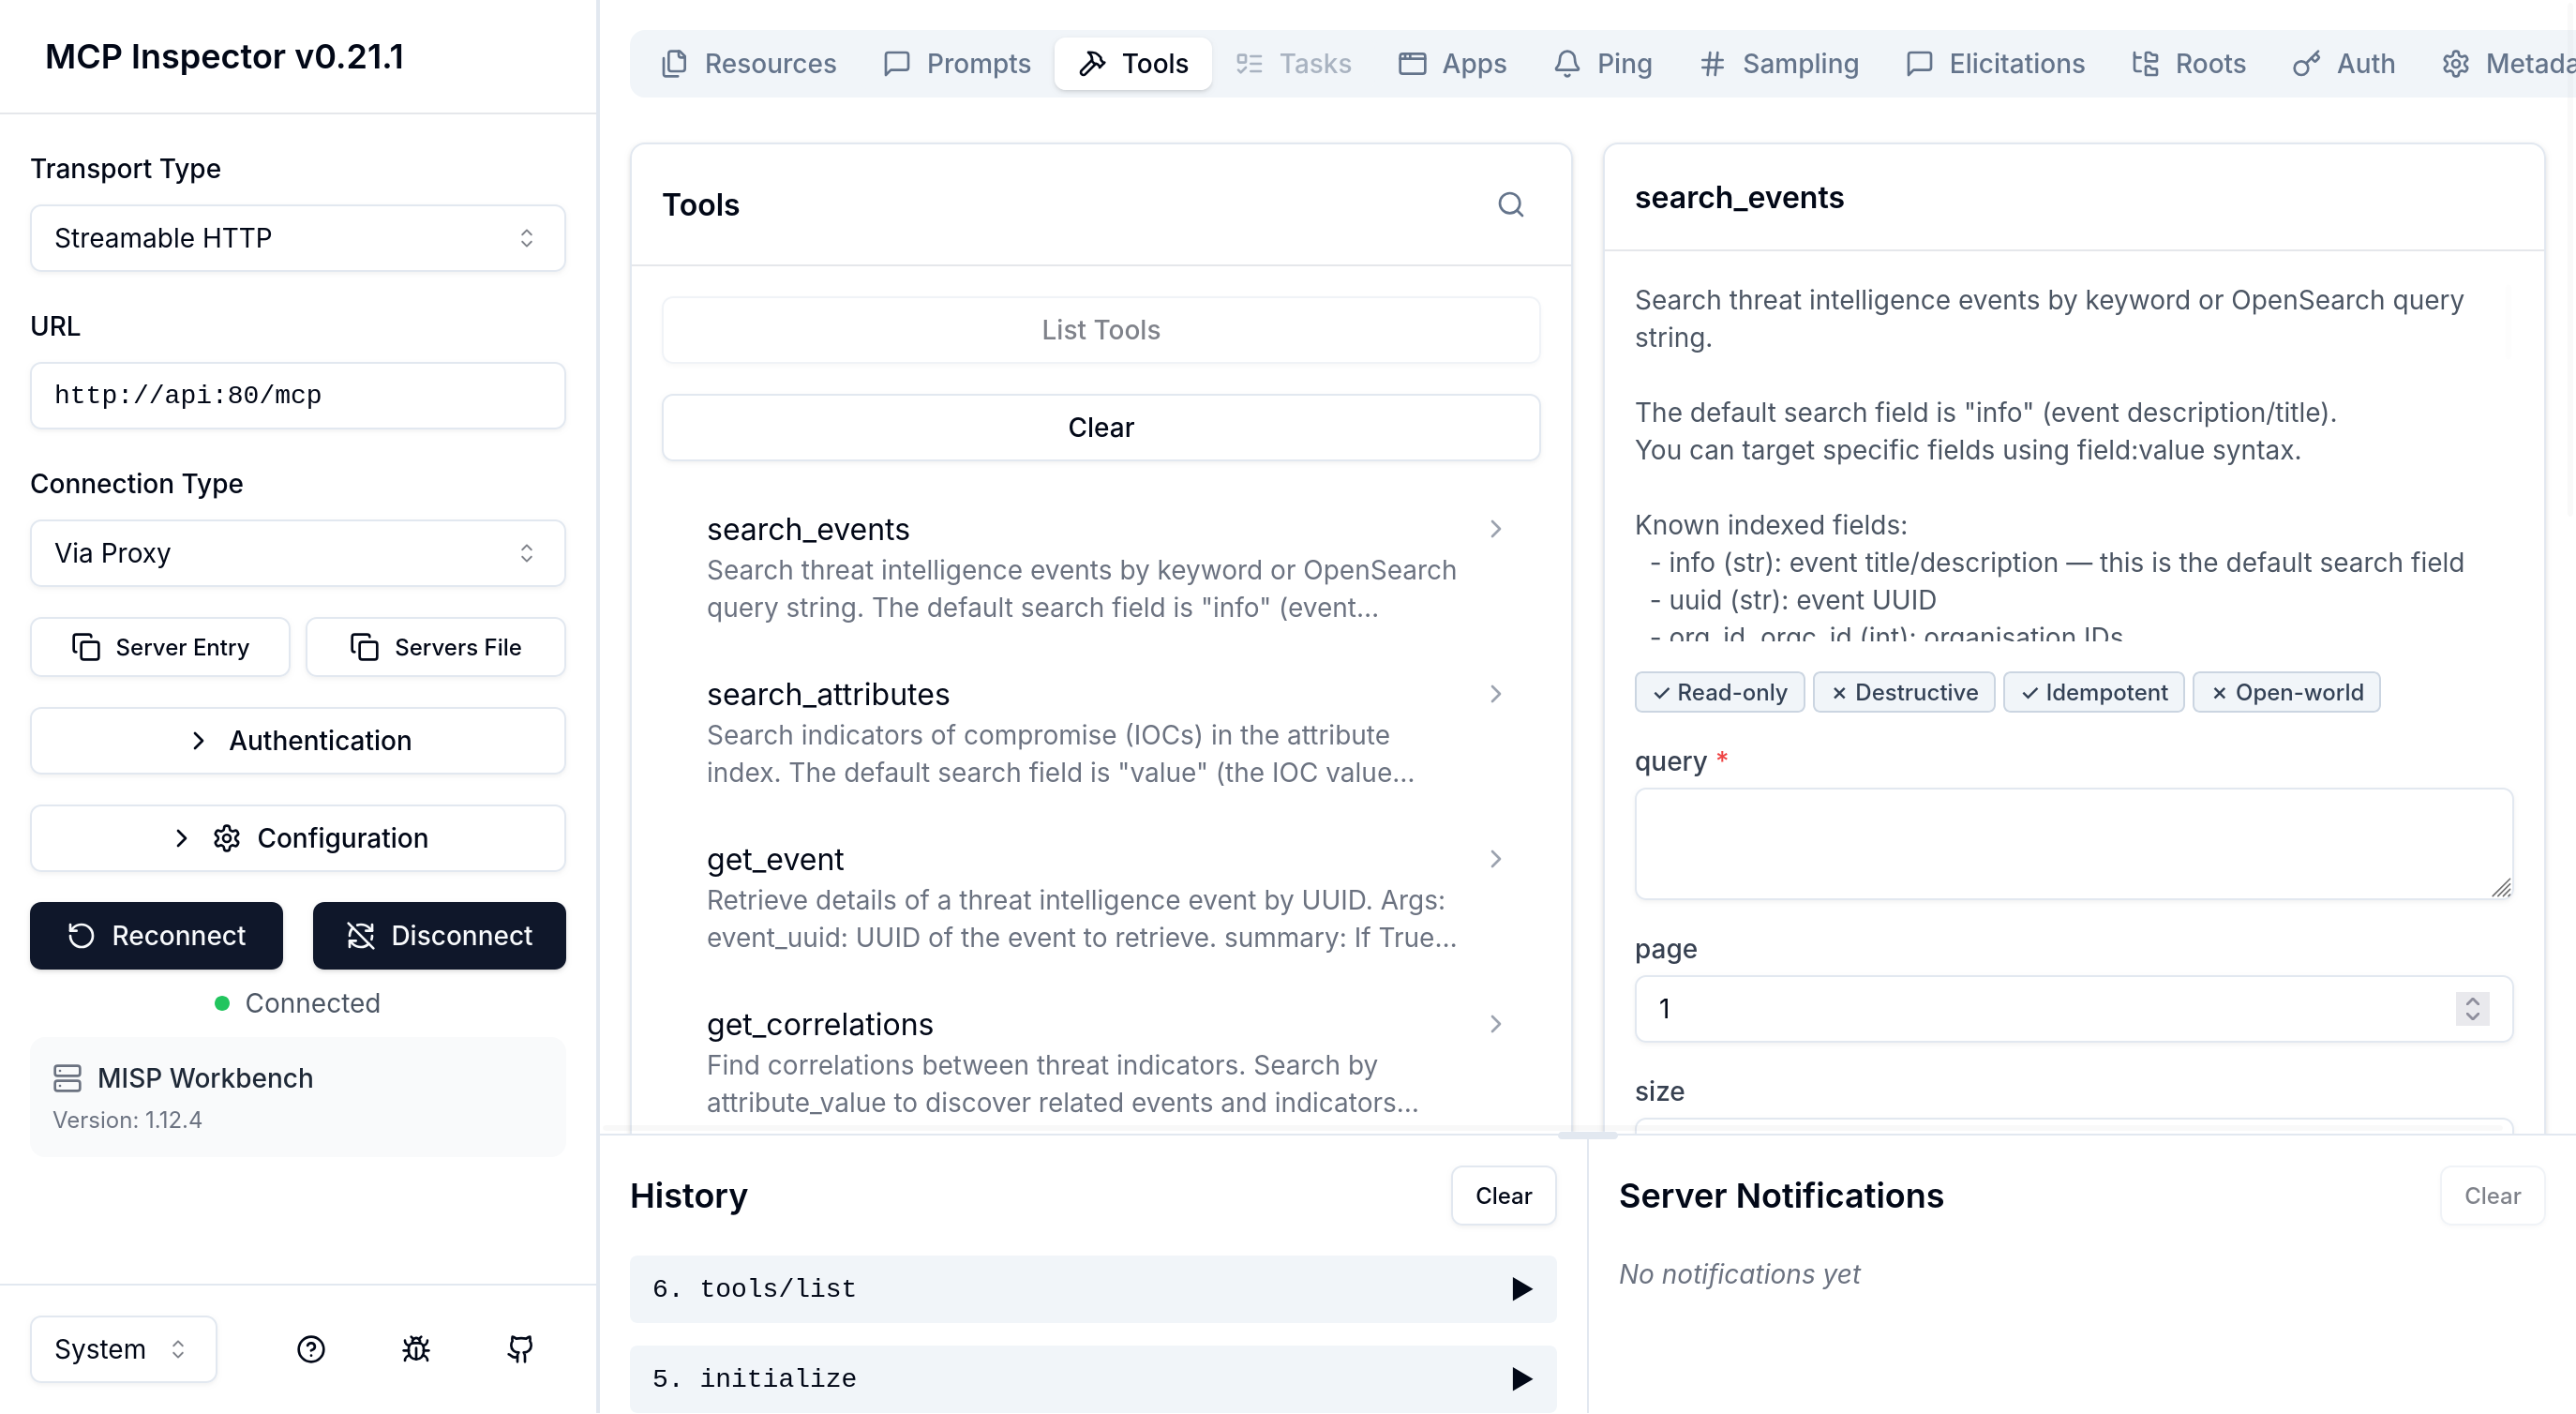
Lists all misp:// resources. Select one and click Read to fetch its content. Useful for checking that the galaxy and taxonomy submodules are correctly initialised.
Prompts tab
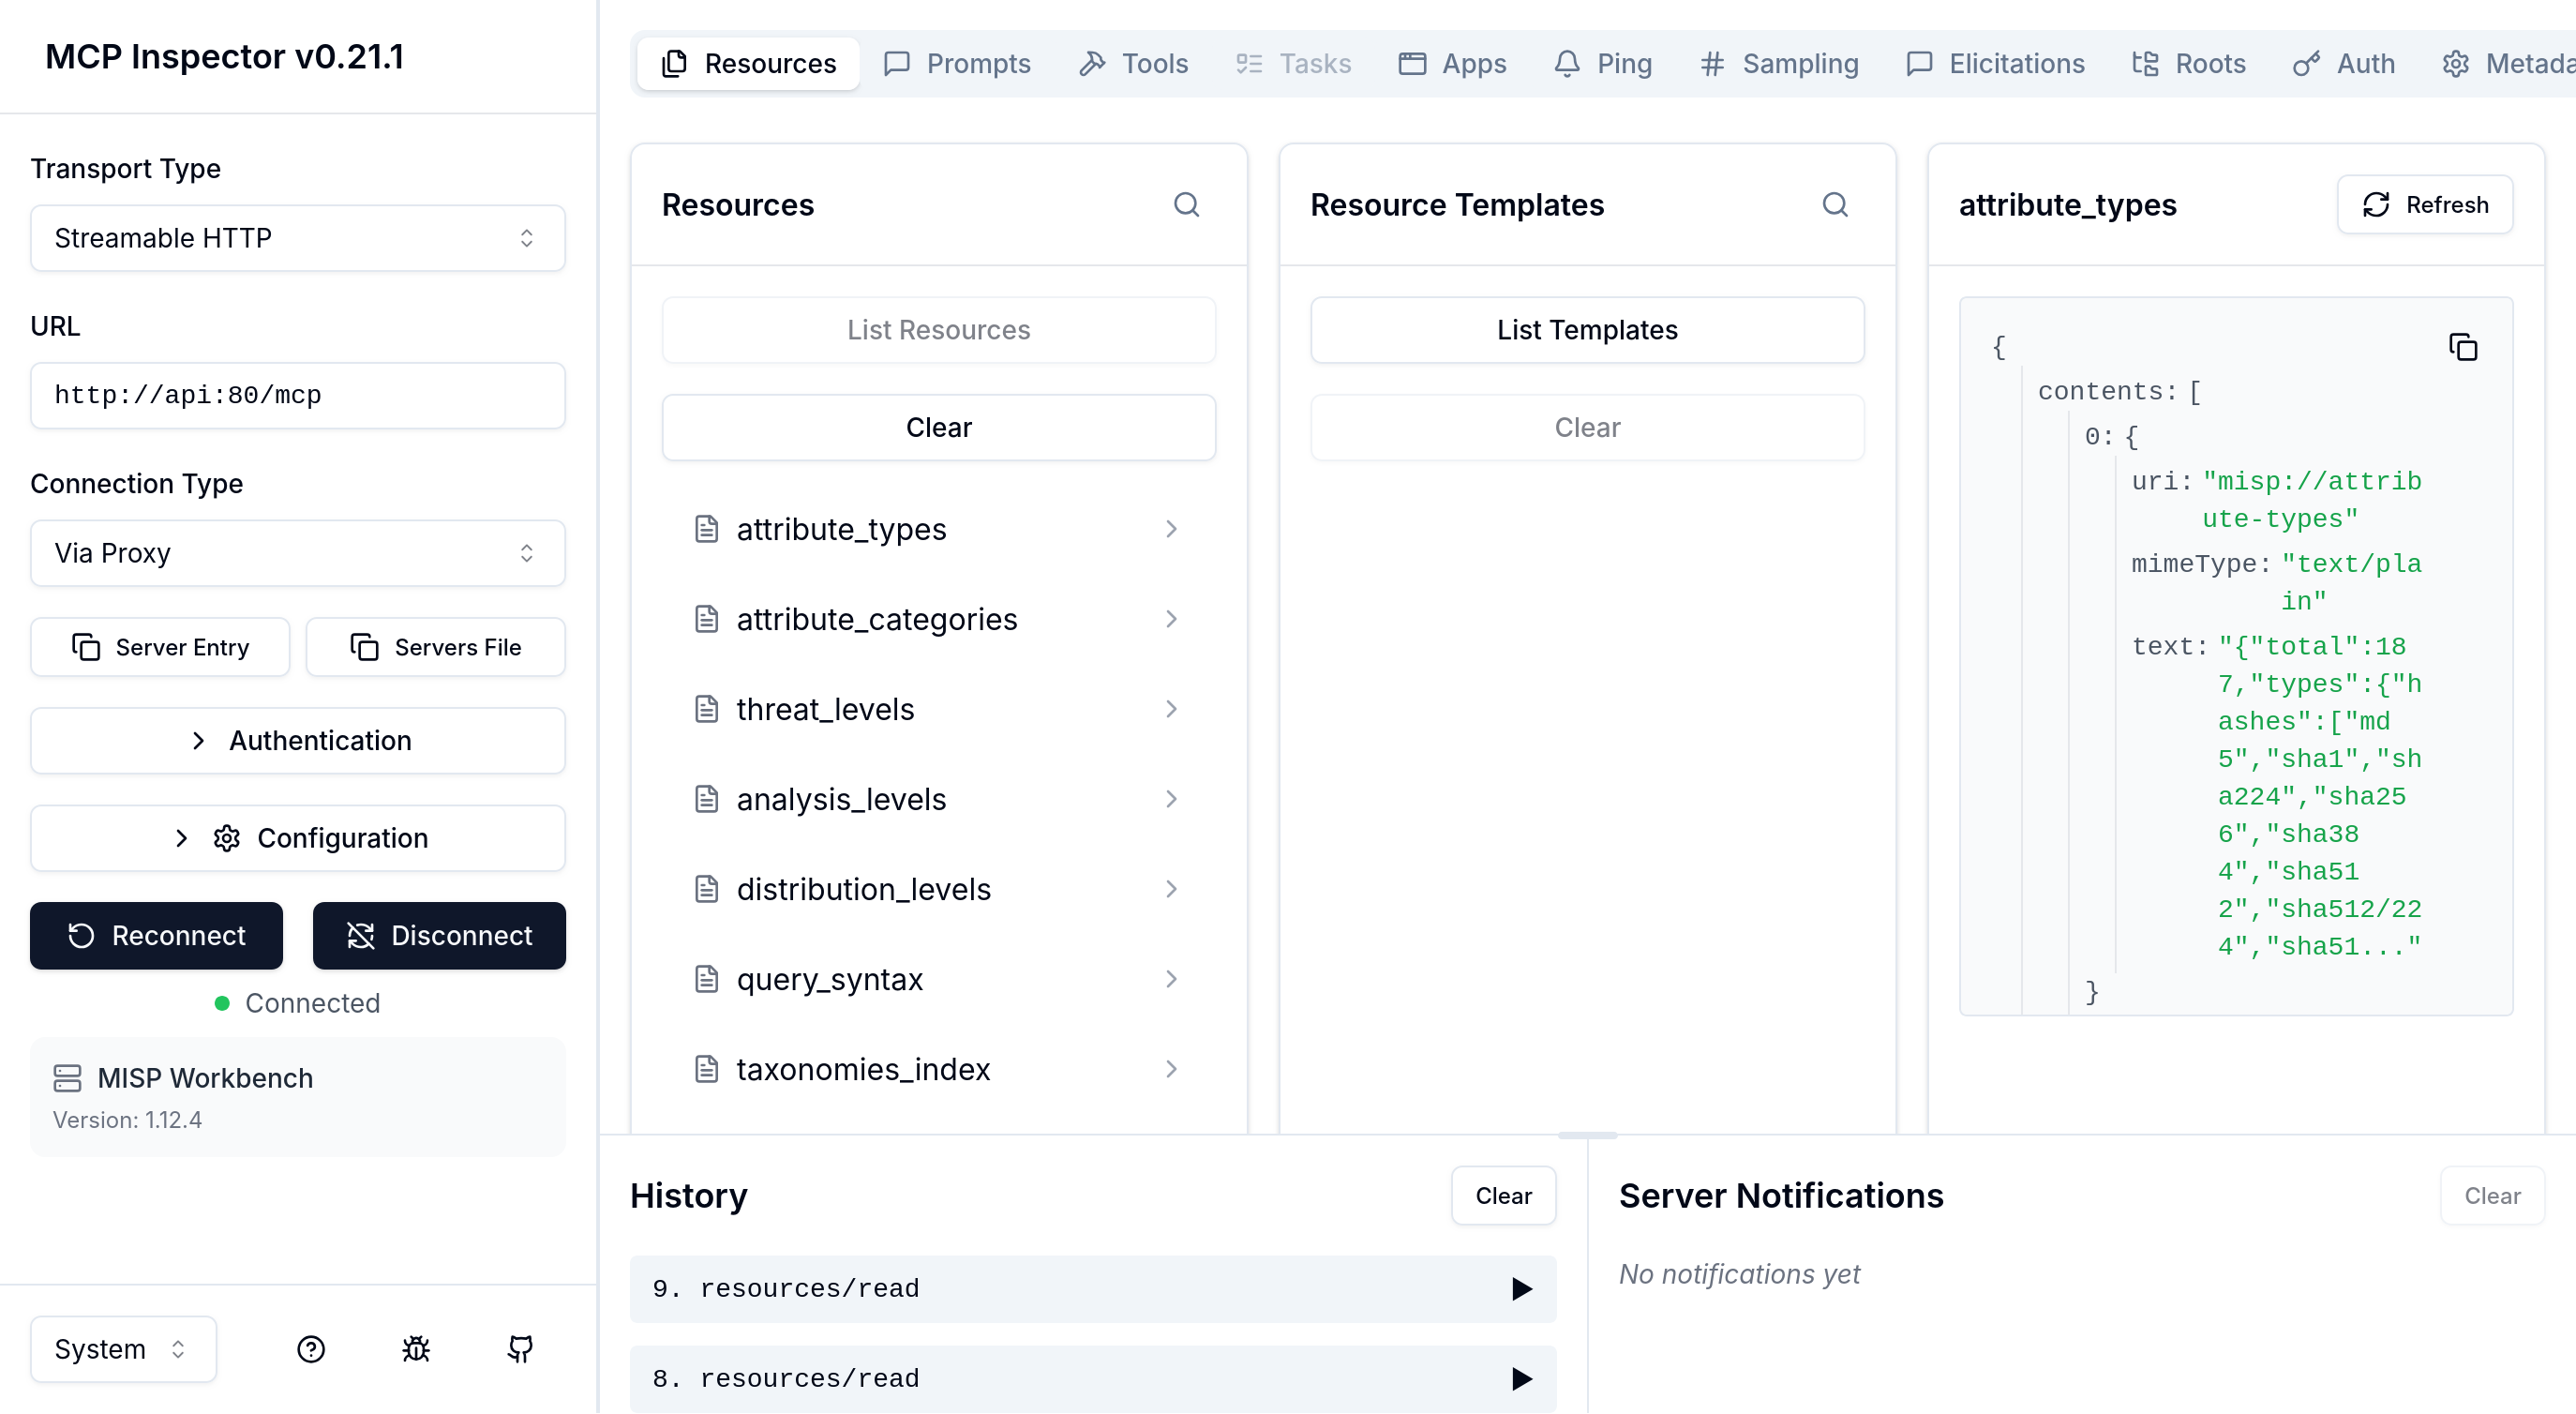
Lists all analysis prompt templates. Select a prompt, fill in the arguments (e.g. keyword: ransomware), and click Get Prompt to preview the message that would be sent to an LLM.