Dashboards
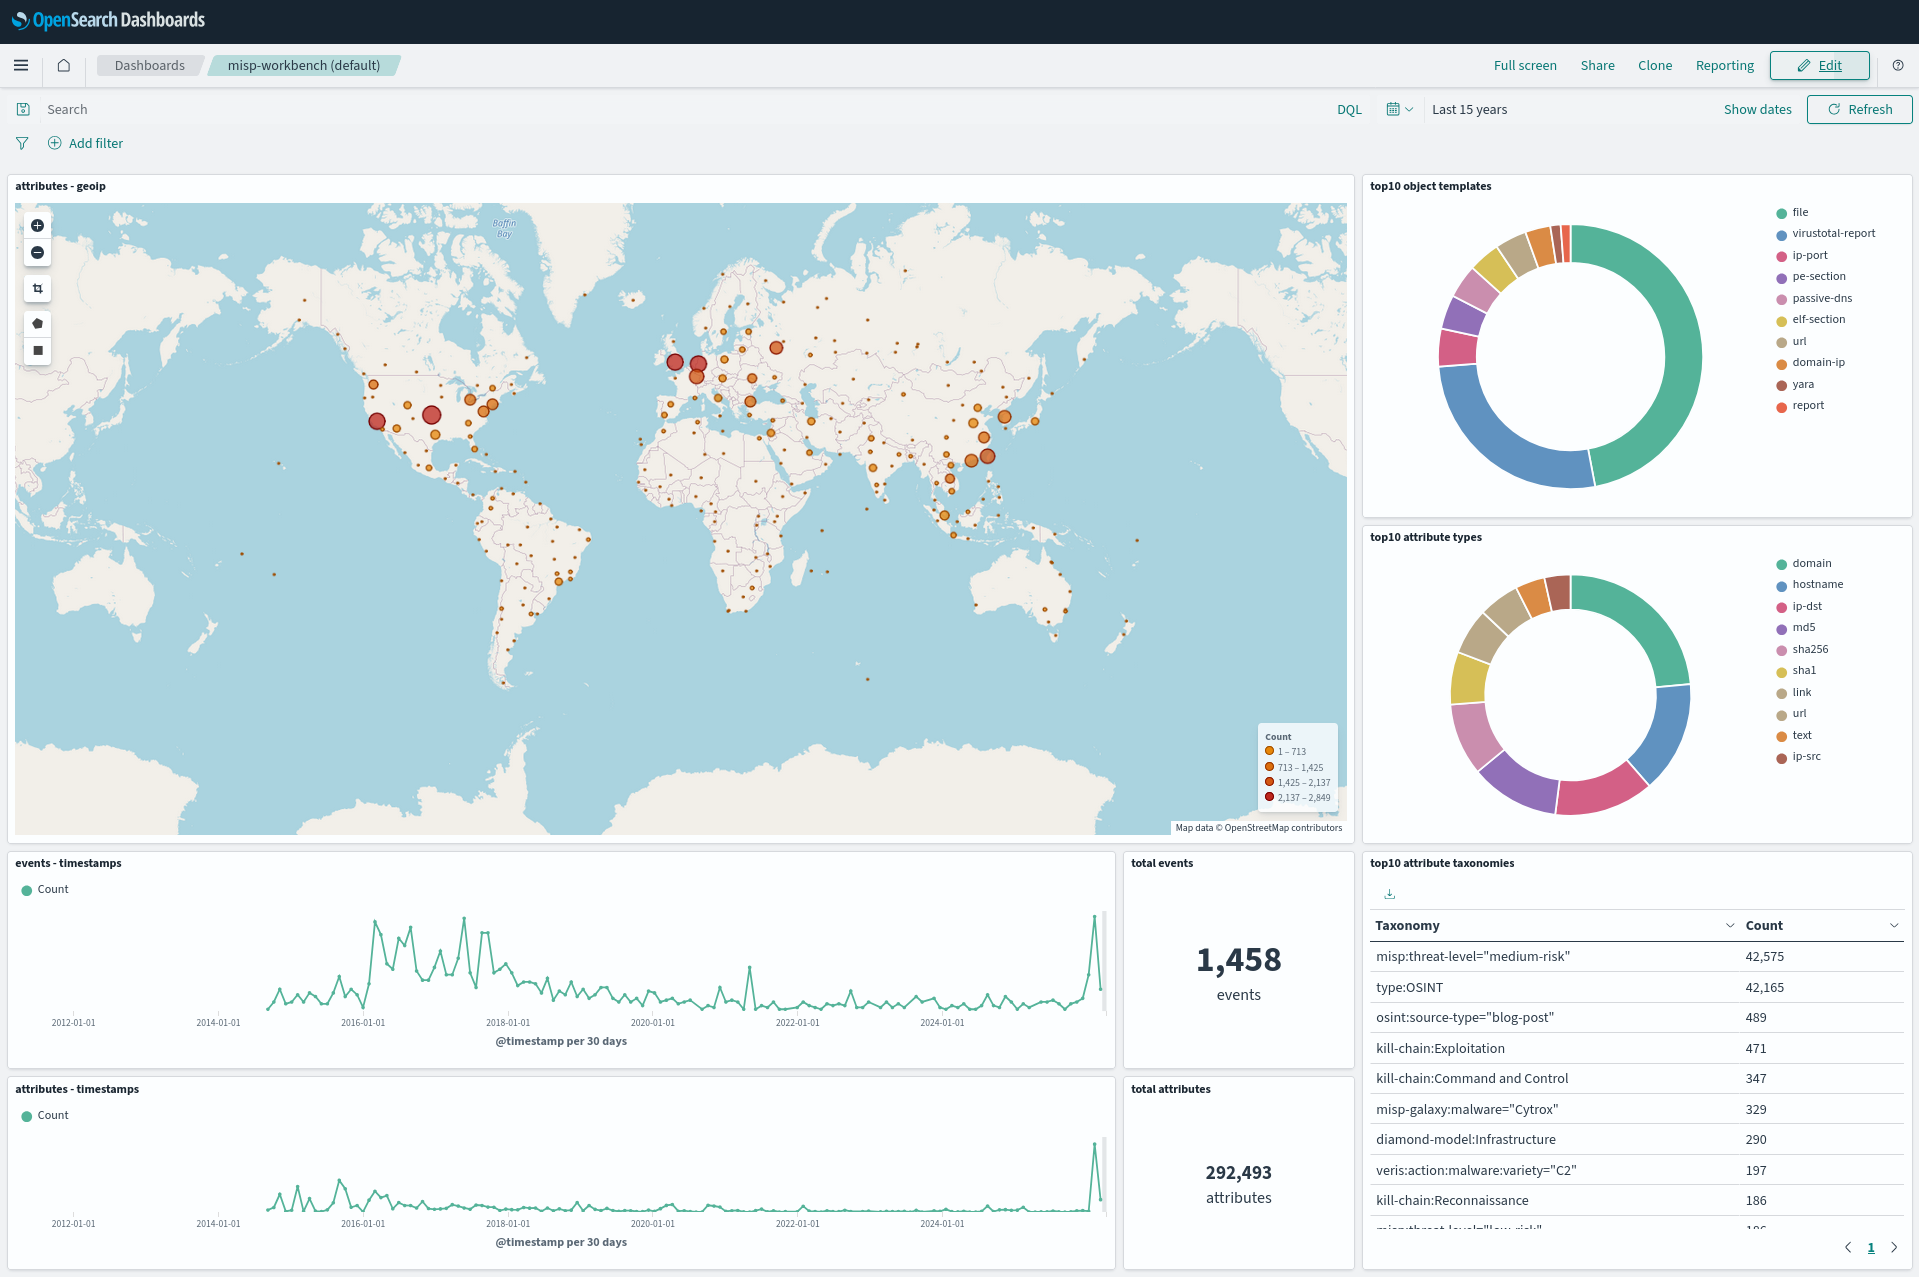
misp-workbench ships pre-built OpenSearch Dashboards that provide visual analytics over your threat intelligence data.
Accessing Dashboards
OpenSearch Dashboards is available at port 5601 by default. In a dev environment this is exposed directly; in production it is secured with the dashboards_system service user.
Pre-built content
The following saved objects are imported automatically on startup:
Index patterns
Defined in opensearch/index-patterns/index-patterns.ndjson. These tell Dashboards which indices to query and how to interpret their fields (e.g. date formats, keyword vs text).
Visualizations
Defined in opensearch/visualizations/visualizations.ndjson. Individual charts, tables, and maps that can be placed on dashboards or viewed standalone.
Because the misp-attributes index includes GeoIP-enriched fields (expanded.ip2geo.location), map visualizations can plot IP-based indicators by geography.
Dashboards
Defined in opensearch/dashboards/misp-lite (default).ndjson. A default dashboard that combines the shipped visualizations into an overview of your threat data.
Customization
You can create your own dashboards, visualizations, and index patterns directly in the OpenSearch Dashboards UI. Custom saved objects are stored in OpenSearch's .kibana index and are not overwritten by the bootstrap process (it uses overwrite=true only for shipped objects).
To export your custom dashboards for backup or sharing:
- Go to Management > Saved Objects in OpenSearch Dashboards
- Select the objects you want to export
- Click Export to download an NDJSON file
- Place the file in the appropriate directory (
opensearch/dashboards/,opensearch/visualizations/, etc.) to have it auto-imported on future deployments